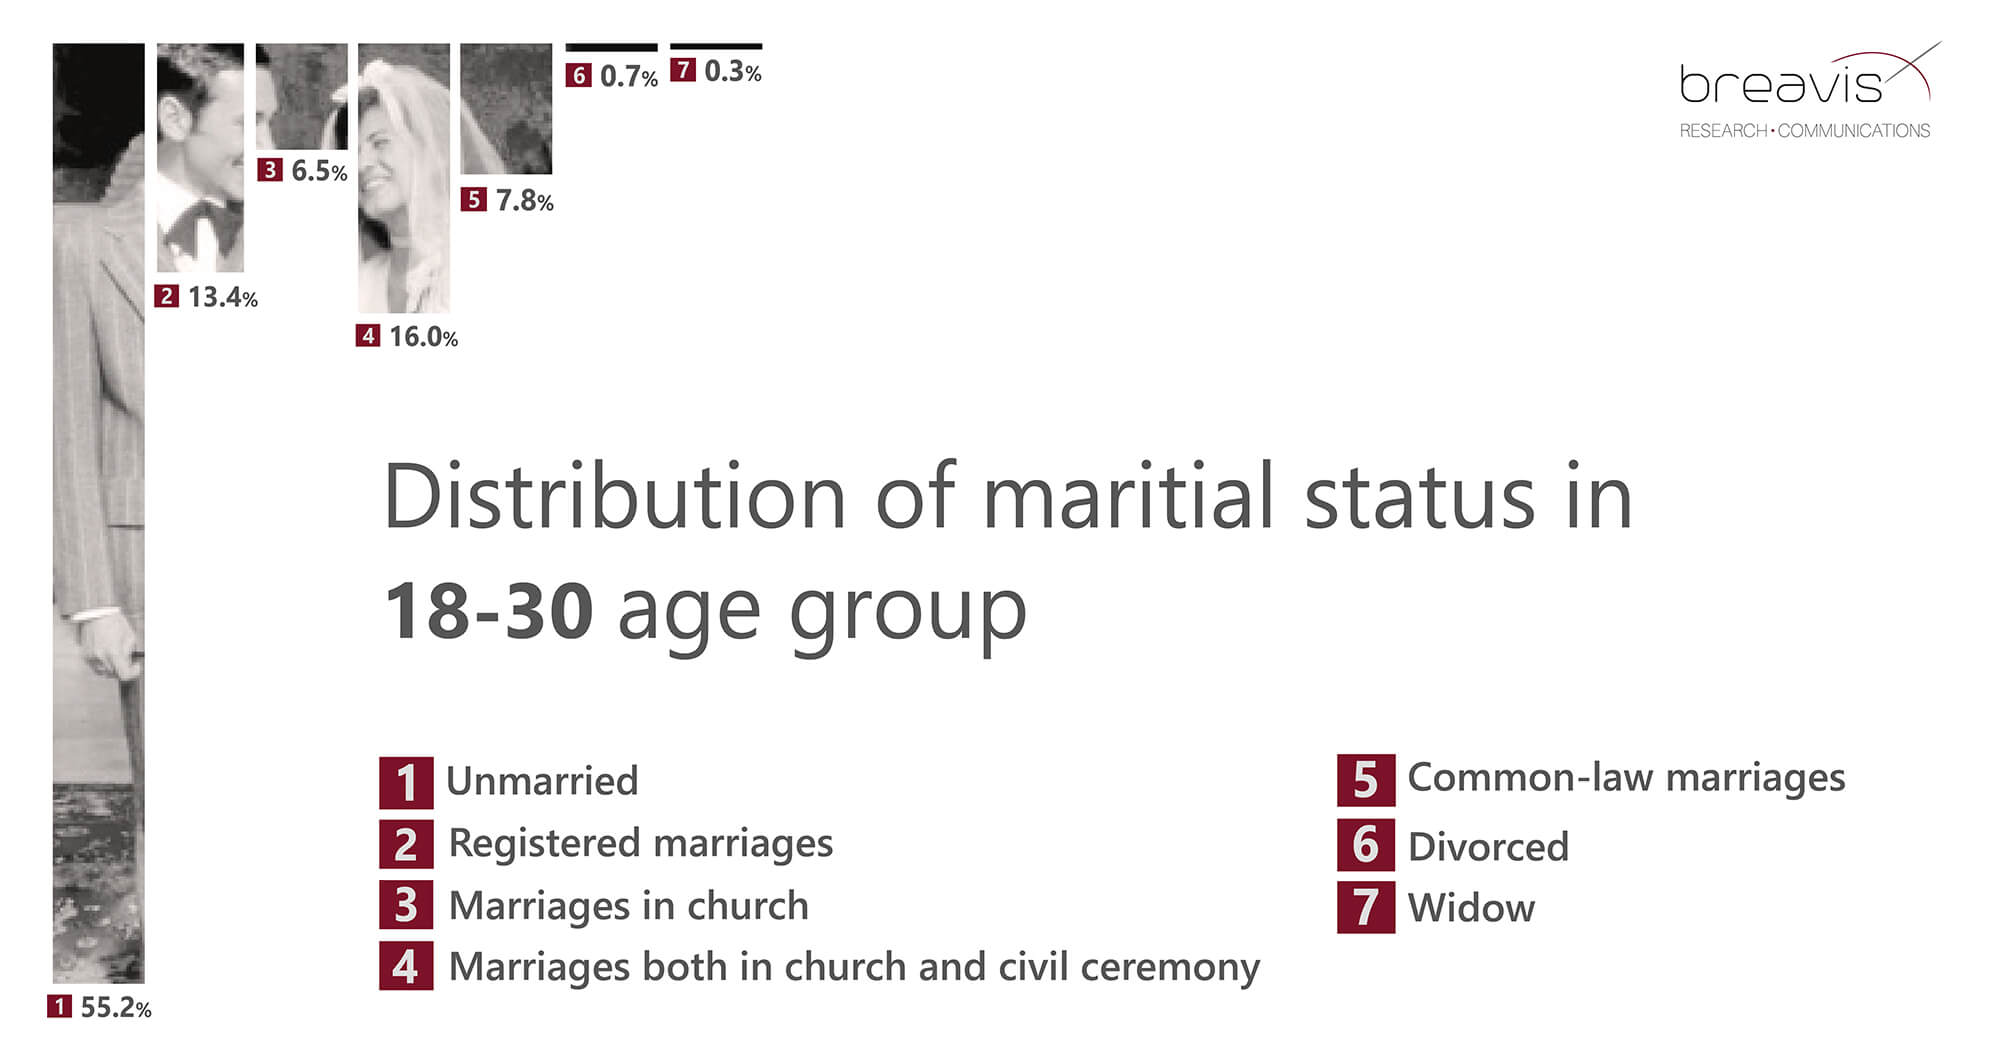
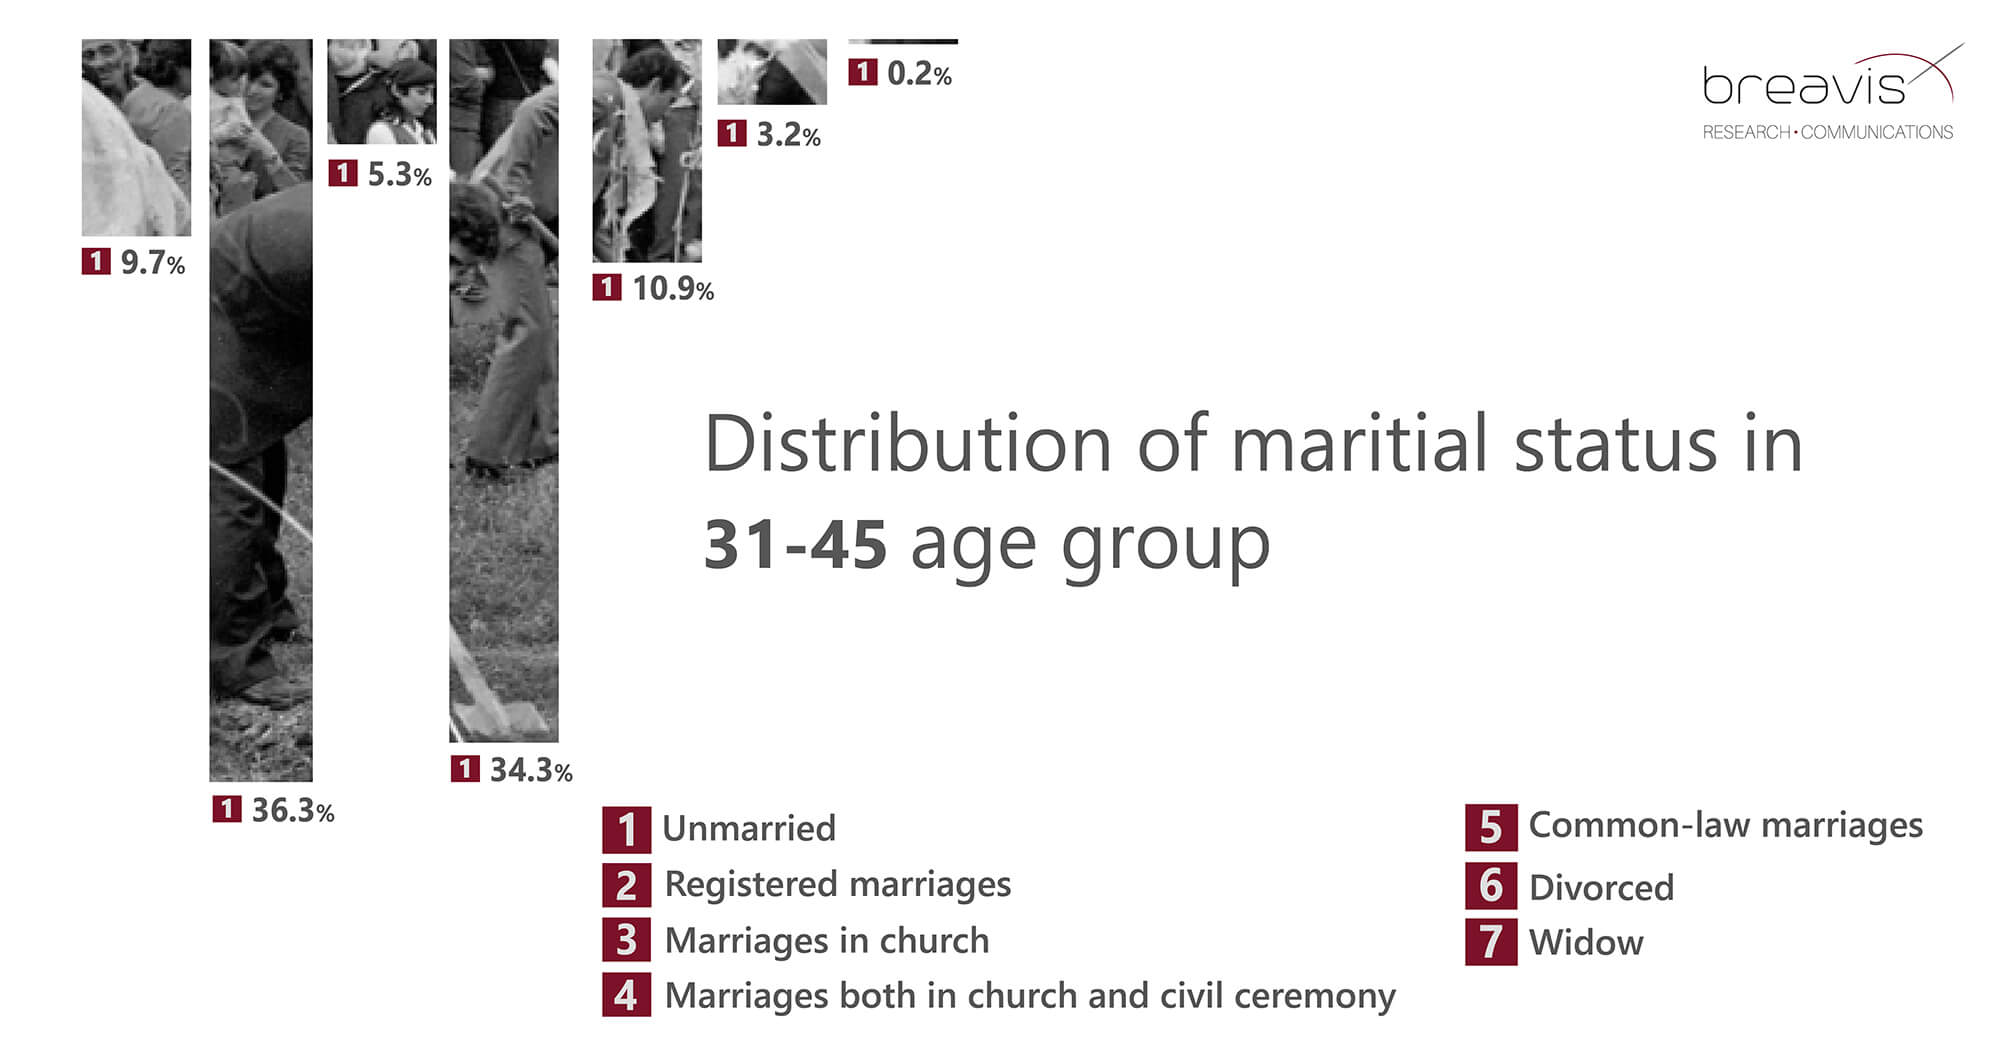
One of our previous articles discussed the share of the unmarried in different age groups. And while on this subject, we further considered the correlation between marital status, age range, and place of residence trying to understand the causes of the observed results.
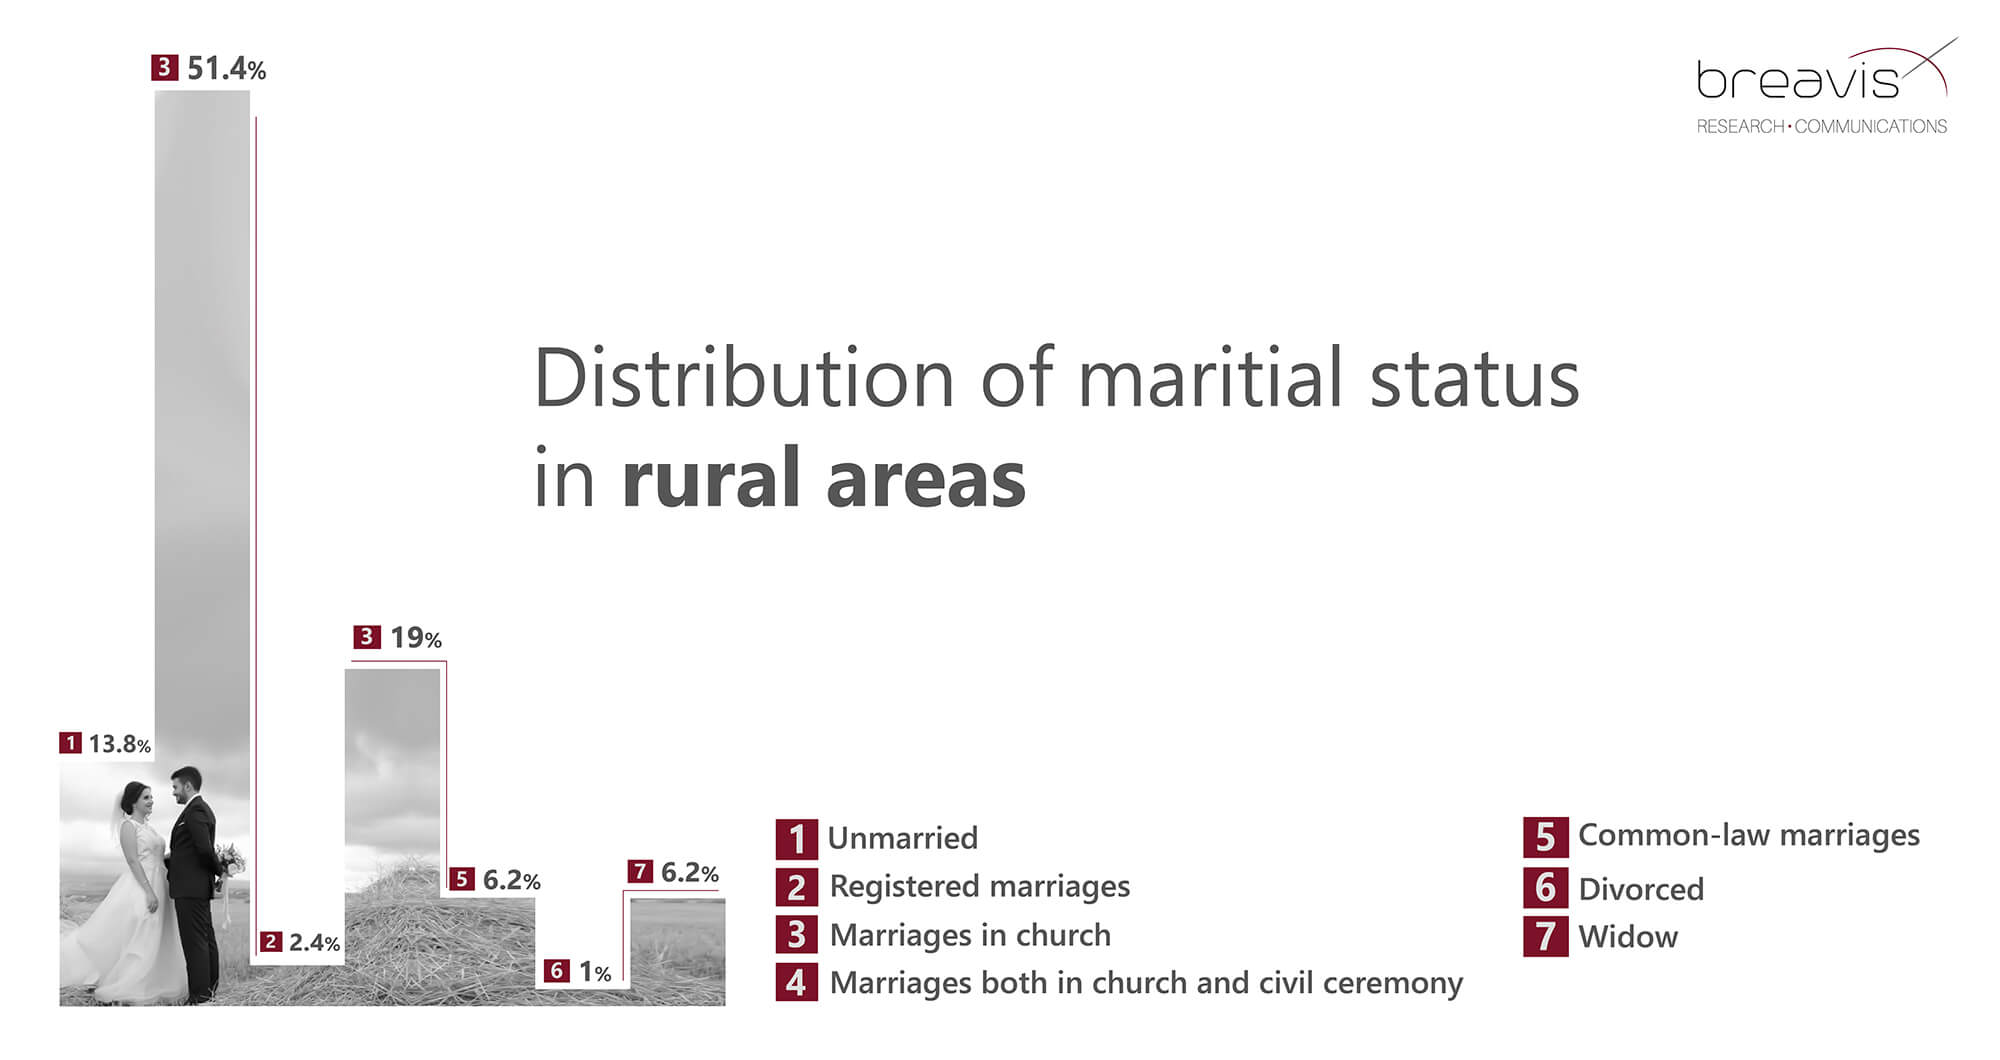
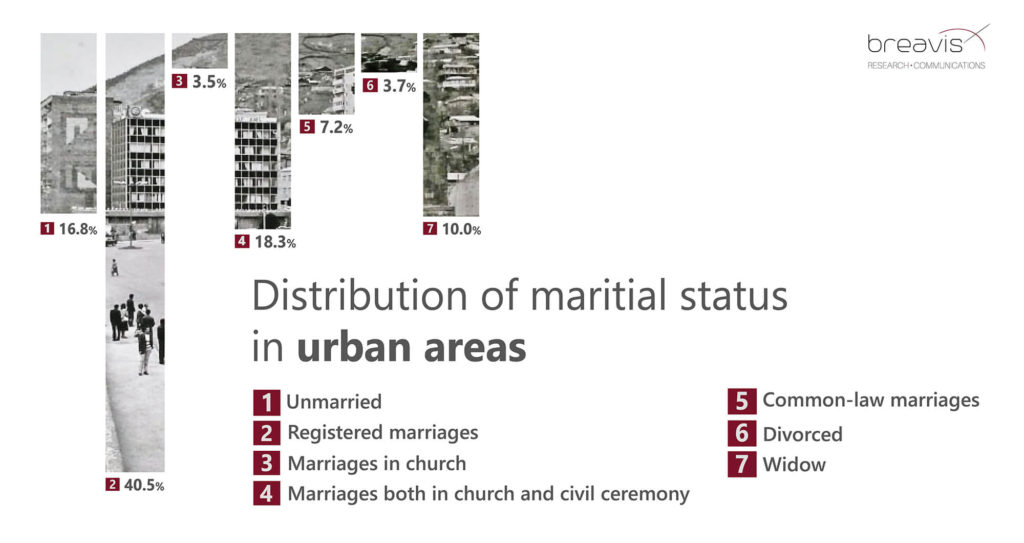
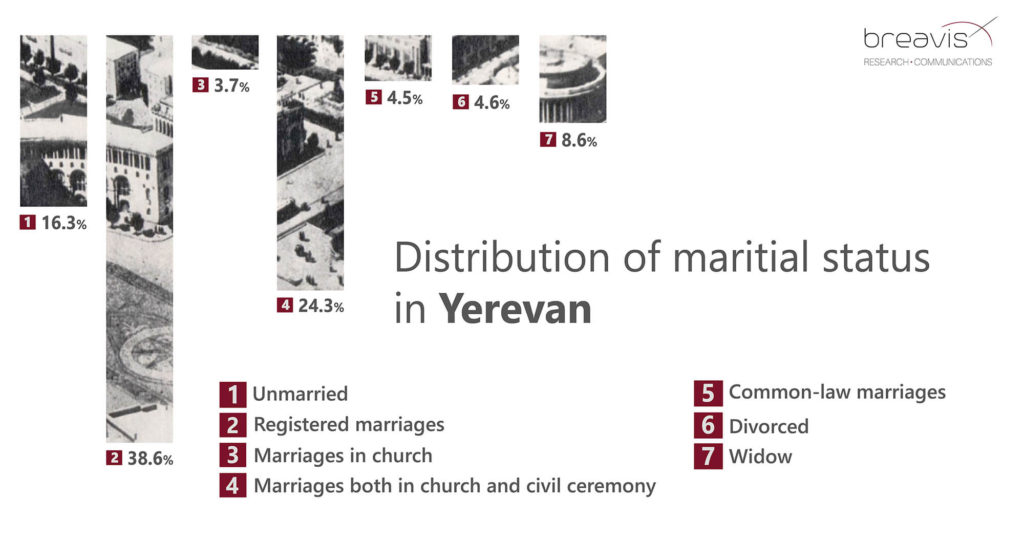
Within the scope of the same survey, we have attempted to analyze the data according to the place of residence. It’s worth to note that in spite of the perception that in rural areas, where people are more conservative, the number of marriages in church is supposed to be higher than the average national, urban and capital figures, the situation is just the reverse: in rural areas the share of those married only in a religious ceremony (2.4%) is lower than the national average being 3%, and is at the same time less than urban (3.5%) and capital (3.2%) figures.
The above stated is also supplemented by the fact that in rural areas the share of civil marriages (51.4%) is higher than that of urban (40.5%) and capital (38.6%).
A more in-depth analysis shows that these indicators have a clear cause-and-effect relationship with the average household income of the respondents. Thus, those with higher income prefer to marry in a religious ceremony, while those with lower income prefer to register their marriage only in the registry offices. This phenomenon can be related to the fact that in our reality marriage in church implies costlier activities as compared to the civil ceremony.
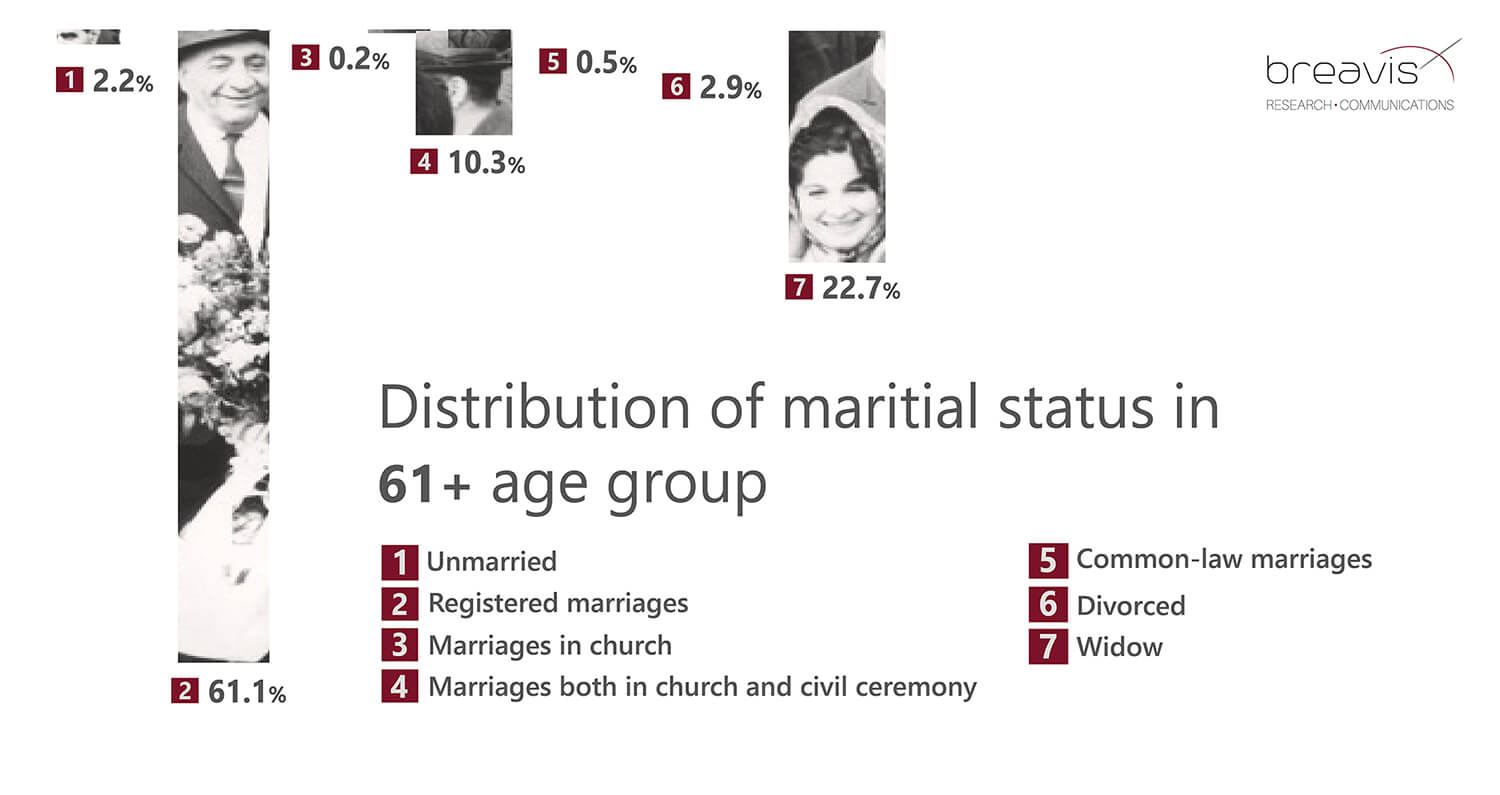
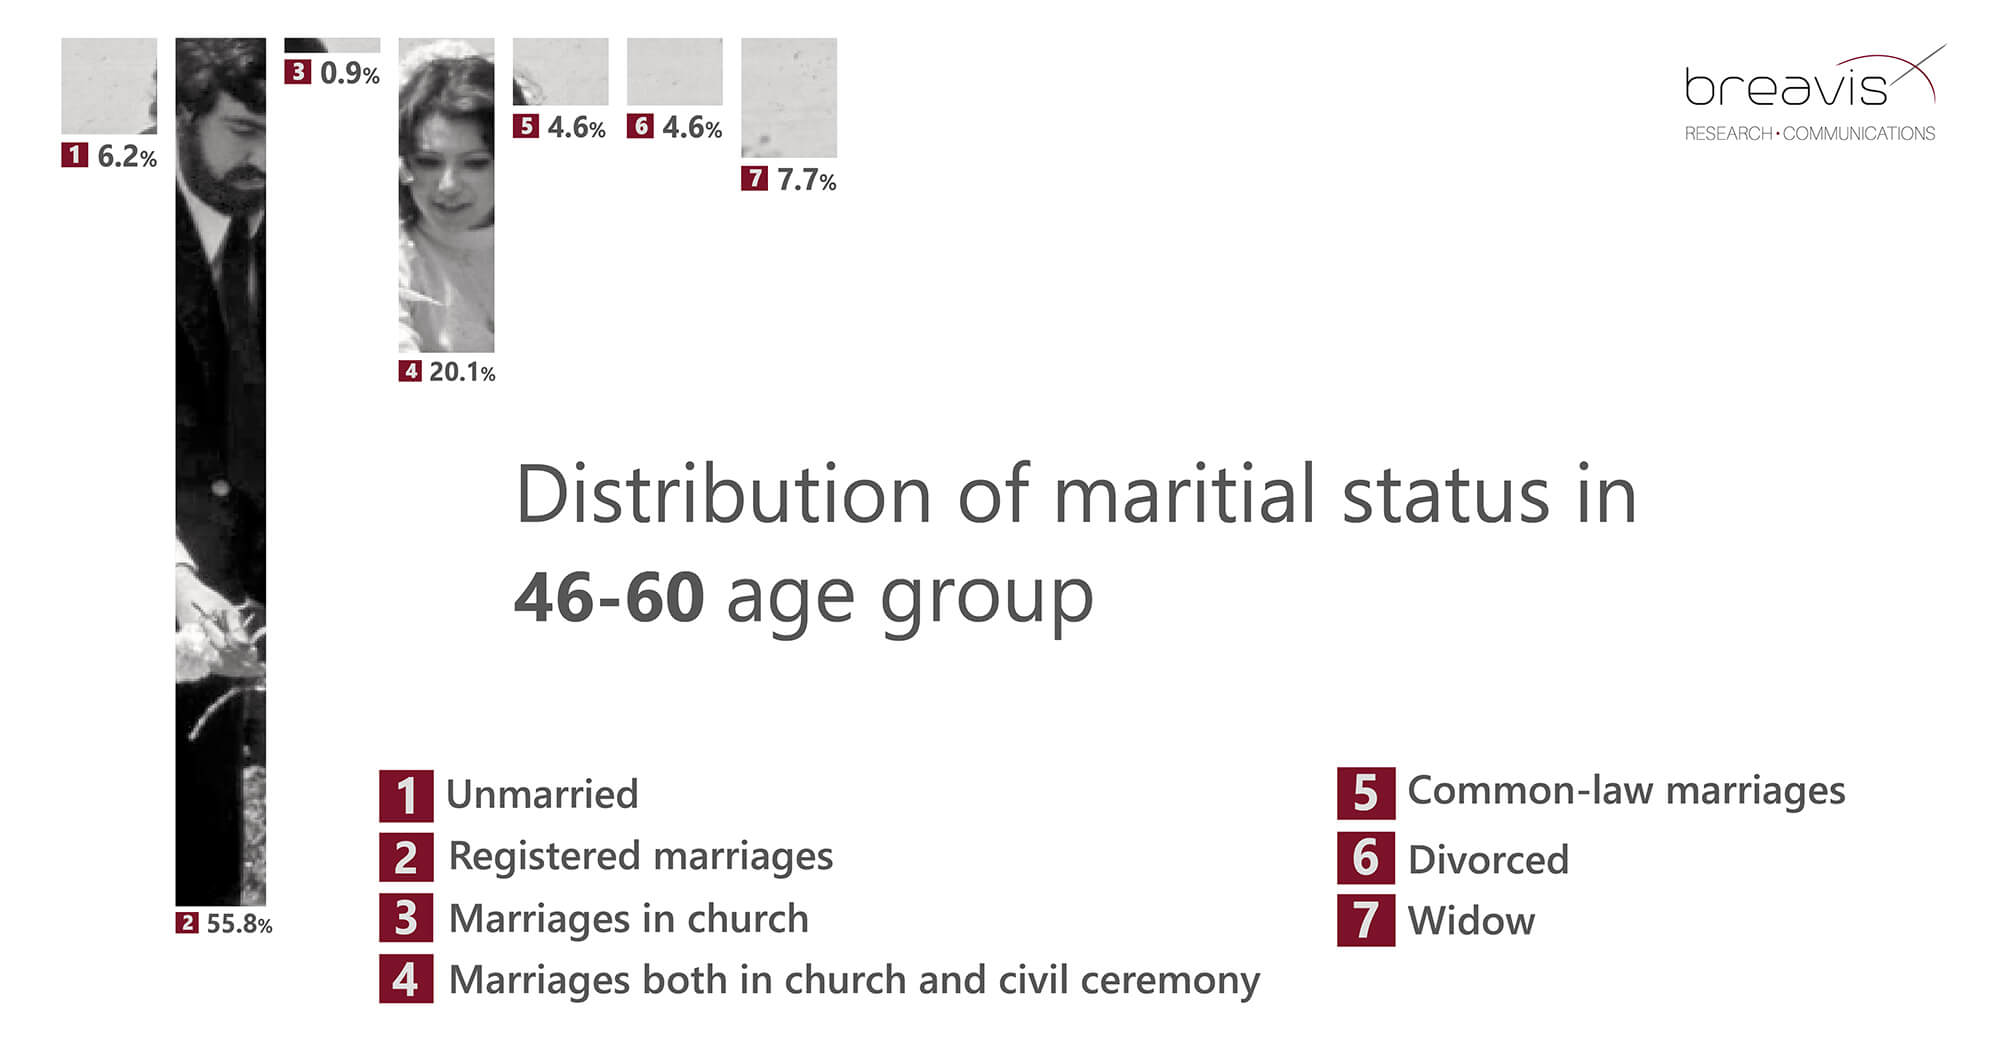
The low divorce rate in rural communities could be explained by the residents’ equivocal perception of this phenomenon: in small communities, only 1% are divorced. In the capital, for example, the divorced make up 4.6% of the population.
The same ambiguous position is present for common-law marriages, however, it does not prevent a higher number of common-law marriages in rural and regional areas (6.2% and 7.2% respectively) than in Yerevan (4.5%). In the rest of the groups, there are no significant differences or variations.
Thus, the analysis of the data creates a picture completely different from stereotypical perceptions.
The survey was conducted in June 2019 among 1602 people throughout Armenia. Reliability level is 95%, boundary error is Δ = ± 2.45% and sincerity is 85.6%.